Why XRP has the potential to exceed Ethereum in the next rally

Why XRP has the potential to exceed Ethereum in the next rally

By Erie Maxwell – December 8, 2020

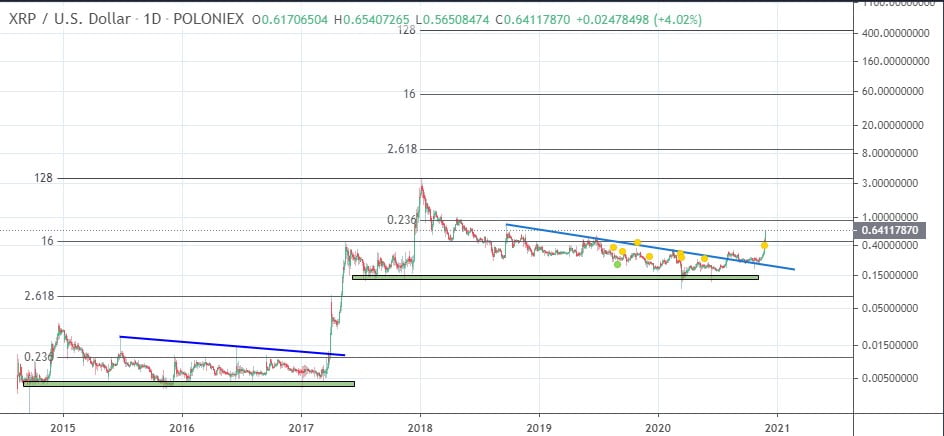
XRP could have been considered a dormant cryptocurrency for the past two years after its all-time high at $3.3 in January 2018. The digital asset had a massive consolidation period losing close to 97% of its value and trending downwards for most of the time.

Every single market push was lower for XRP and every crash was stronger. Things didn’t look good at all for its price which continued tanking while most of the market was recovering. It wasn’t until November 16 that XRP finally had its breakout from a low of $0.26 to $0.495 in just one week and saw a ton of continuation on the next week peaking at $0.78.

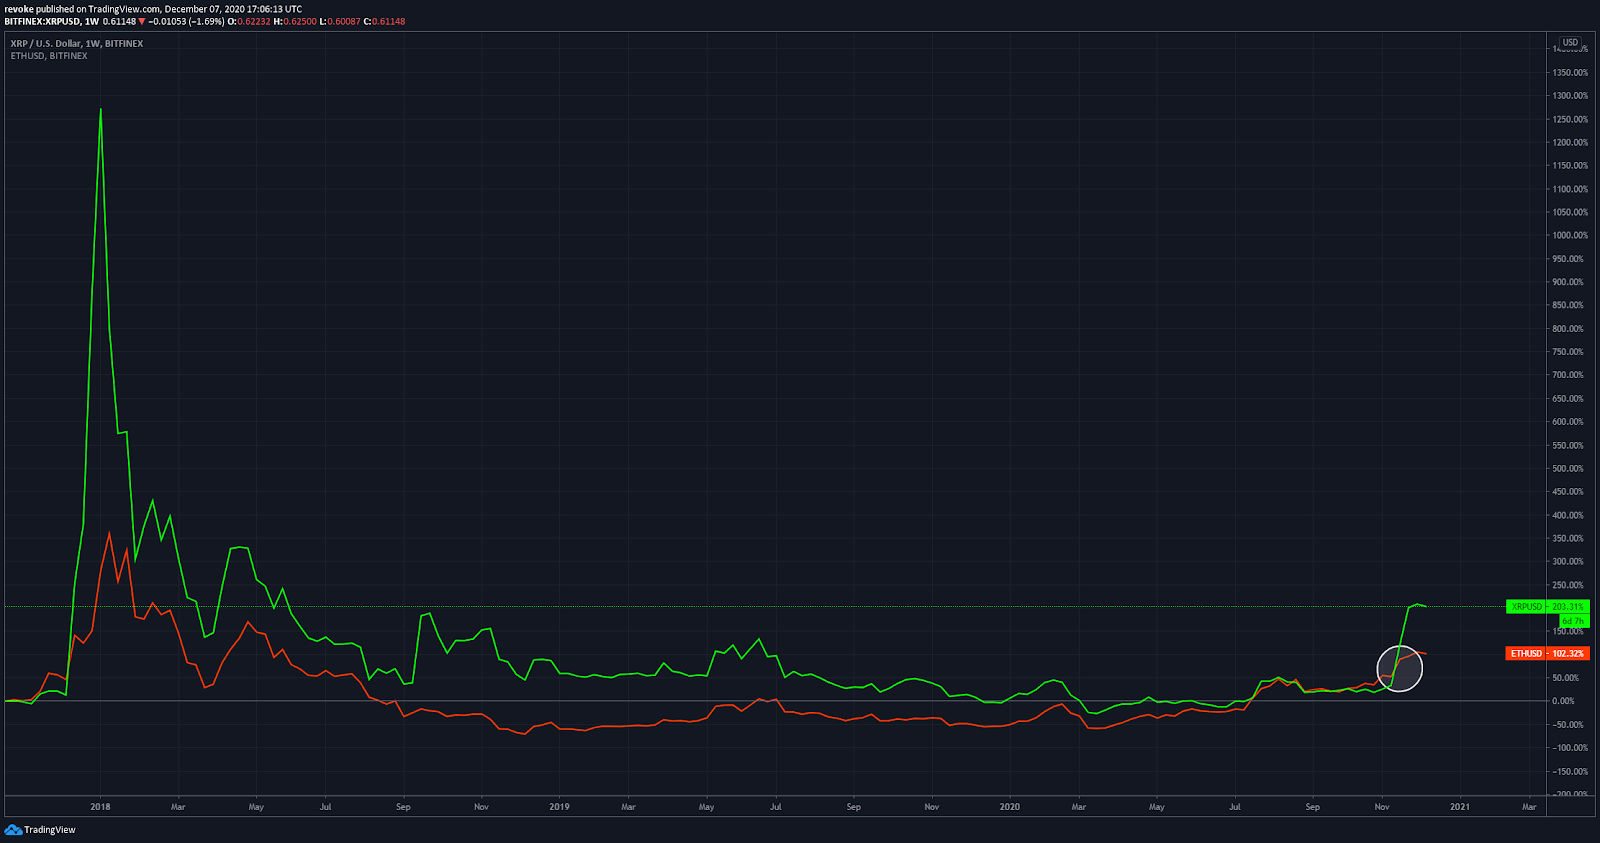
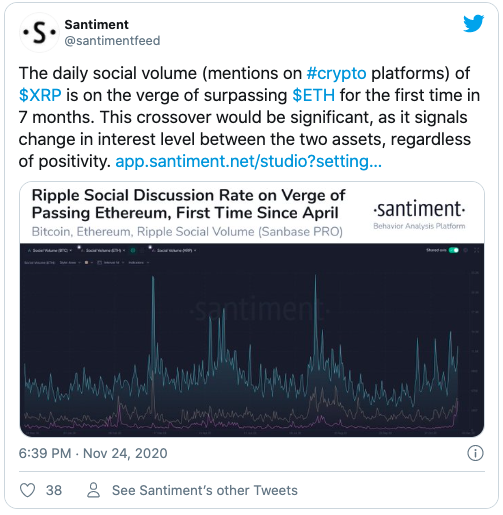
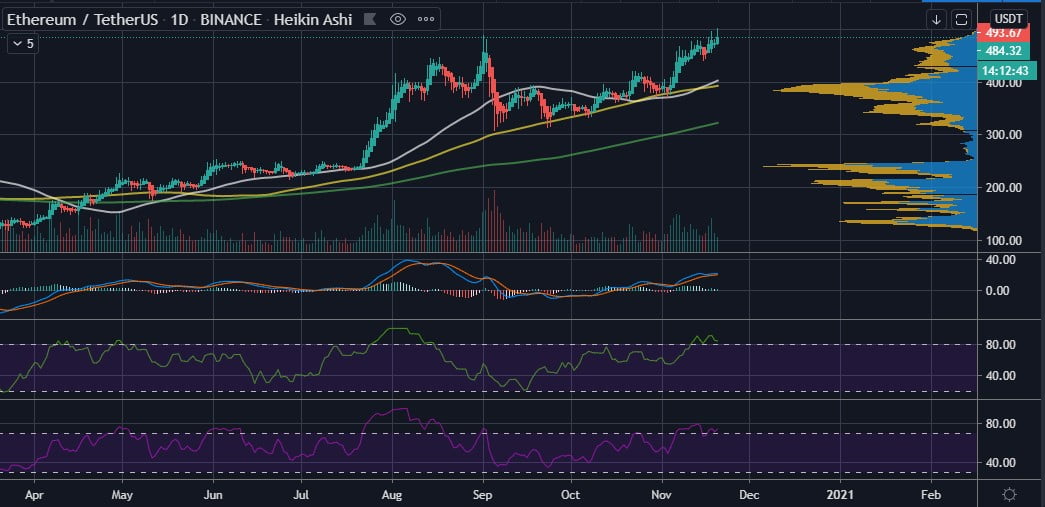
The comparison chart between XRP and ETH clearly shows how XRP’s price peak was far more pronounced followed by a massive crash. Around November, XRP breaks the correlation with Ethereum and outperforms the digital asset by 2x.

XRP will face very little resistance to the upside

Because of the massive crash from its all-time high, XRP bears didn’t leave many resistance levels on the way down. The most recent 200% rally has taken out several critical resistance points on the weekly chart since September 2018.

The only potential risk for the bulls is the possibility of forming a double top as the peak of $0.78 is just below the high of September 17, 2018, at $0.791.

A breakout above this level would quickly drive XRP price towards the next significant resistance level at $0.966 which seems to be the last one before a new all-time high.

Additionally, it seems that the number of XRP whales holding at least 10,000,000 ($6,117,000) or more coins has increased significantly over the past two weeks and has been in an uptrend since October, showing that large investors are highly interested in the digital asset and increasing the buying pressure. 

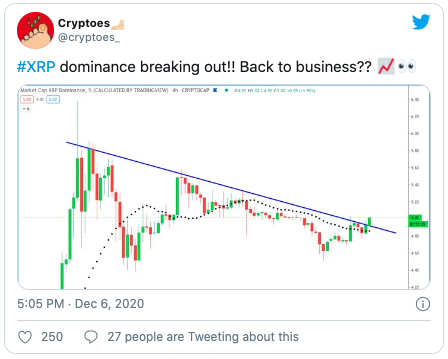
It also seems that XRP’s dominance is finally breaking out from a massive trendline formed all the way at the top. Do you think this will be enough for XRP to hit a new all-time high and perhaps beat Ethereum?

Learn all about Cryptocurrency
Advertisement

DISCLAIMER

The views expressed in the article are wholly those of the author and do not represent those of, nor should they be attributed to, ZyCrypto. This article is not meant to give financial advice. Please carry out your own research before investing in any of the various cryptocurrencies available.

The original article written by Erie Maxwell and posted on ZyCrypto.com.

Article reposted on Markethive by Jeffrey Sloe

XRP Poised To Overtake Ethereum On This Crucial Metric For First Time In Seven Months

XRP Poised To Overtake Ethereum On This Crucial Metric For First Time In Seven Months

By Brenda Ngari – November 26, 2020

Like a few other altcoins, XRP has been riding the bitcoin boom. The digital token has surged a monumental 210% in the past 14 days. Along with the strong rally, XRP is on the brink of surpassing ethereum on one key metric.

Crypto analytics firm Santiment has observed that XRP’s social engagement volume is exploding with the cryptocurrency primed to become the second-most mentioned coin on social platforms just behind bitcoin. 

What XRP Surpassing Ethereum In Terms Of Daily Social Volume Means

In a Nov. 25 tweet, researchers at Santiment indicated that the daily social activity around XRP is about to overtake that of ethereum. The last time such a scenario was witnessed was seven months ago.  

This move would be extremely positive for XRP as it suggests that investors’ interest is shifting from ethereum to XRP.

Santiment has also noted the high level of development activity around XRP. The firm says that this is another encouraging metric for the long-term upward trend of the cross-border payments token. 

Specifically, the development activity by Ripple on the XRP Ledger is currently five times higher than it was roughly one and a half years ago. “Our findings are that frequent GitHub submissions (filtering out routine daily tasks) are indicative of long-term viability of projects and their ability to grow in market cap and effectiveness,” Santiment said.

A Bigger Rally Brewing?

XRP was stuck in the $0.17-$0.30 range for the better part of last year and this year as well. The coin subsequently became the worst-performing large-cap cryptocurrency. 

However, XRP shocked the cryptocurrency markets in the past days following a mesmerizing rally. As bitcoin climbed past $19,000, XRP ripped to $0.68 heights. The altcoin has actually outperformed bitcoin with 136.48% weekly gains while bitcoin is up only 5.45% over the same period. Additionally, XRP has managed to regain its spot as the third-largest cryptocurrency.

Despite the recent ascent, XRP is still down approximately 79.9% from its January 2018 all-time high. But the bullish metrics highlighted by Santiment may spark an even bigger rally for XRP.

ecosystem for entrepreneurs
Markethive Advertisement

DISCLAIMER

The views expressed in the article are wholly those of the author and do not represent those of, nor should they be attributed to, ZyCrypto. This article is not meant to give financial advice. Please carry out your own research before investing in any of the various cryptocurrencies available.

The original article written by Brenda Ngari and posted on ZyCrypto.com.

Article reposted on Markethive by Jeffrey Sloe

XRP Could Hit 440 due to Runaway Inflation amp Money Printing Analyst

XRP Could Hit $440 due to Runaway Inflation & Money Printing – Analyst

John P. Njui   •   XRP NEWS   •   NOVEMBER 24, 2020

Quick take:

  • MagicPoopCannon has explored the idea of XRP hitting $440
  • $440 per XRP would put its marketcap at close to $20 Trillion
  • His analysis and $440 target is based on a worldwide case of hyperinflation and central banks continually printing fiat
  • $440 is a bit extreme with the TradingView community pointing out it is unrealistic

The digital asset of XRP has continued on its impressive parabolic run hitting a two-year high of $0.78 – Binance rate. This means that the remittance coin of XRP has increased in value by 225% in the month of November alone. At the time of writing, XRP has dropped to the $0.71 price area as investors anticipate more bullishness from the digital asset.

$440 Per XRP due to Runaway Inflation and Money Printing

According to Bitcoin and Crypto analyst, MagicPoopCannon, XRP could go as high as $440. His analysis is based on a worst-case scenario of global hyperinflation and continual money printing by central banks.

Here is the technical case for how XRP could possibly rise to $440…I know there will be people who comment how that would make XRP worth trillions (around $20 trillion according to my calculations) and that such a feat is impossible for a cryptocurrency like XRP.

I just want to end that argument by reminding everyone that the global money supply is constantly expanding. A $20 trillion dollar XRP market cap would be hard to imagine with the current global monetary supply, but the global monetary supply already appears to be entering a period of accelerated expansion.

Continuous printing and runaway inflation could easily make this a possibility, and with the looming global debt crisis in the background, nothing is beyond the realm of reason.

How XRP Will Reach $440

Magic further points out that XRP’s bear market since 2018 is very much similar to the one it had in 2015. If history repeats itself, XRP could experience a bull run similar to 2017’s that could propel it to $440. His analysis is based on Fibonacci retracements as explained below with an accompanying chart of his analysis.

Now, if we look back to the initial breakout from 2017, we can see that the first resistance level was at the 2.618 retrace. Currently, the 2.618 retrace is above $9! So, if XRP is going to perform similarly, we would need to see a massive rally to $9 in the near future.

From there, we saw XRP eventually rise to the 16 retracement, and then the 128, which is interesting to me because 128 is a multiple of 16. Anyway, if XRP performs similarly, it would then rise to the $55 level (the 16 retracement) and then eventually to the $440 level (the 128 retracement.)


(Click image for larger view)

TradingView Community Reacts to his $440 Prediction of XRP

The TradingView community was quick to throw cold water onto Magic’s XRP $440 price prediction with many pointing out that it was too far-fetched. Below is a sample of some of the responses to his analysis on the charting platform.

why am I still subscribed to this idiot? $1.50 here we come tho lol. – CryptoeChris

He’s 100% always wrong. He was completely wrong on bitcoin with his nvt and linear crap. He called for btc to collapse and even said it was worthless. He was utterly wrong on the stock market in April when he claimed he was 100% sure the top was in, yea ok!. He was absurdly wrong on his call for Trump winning a second term. wrong Wrong WRONG. Lol! – StreetGainer

whatever you’re smoking, i want some – Jolgan

NOTE: Last paragraph was deleted, due to vulgar content.

Original article posted on the EthereumWorldNews.com site, by John P. Njui.

Article re-posted on Markethive by Jeffrey Sloe

Ethereum Tests 500 as ETH20 Deposits Hit 20 of 524288 ETH Needed

Ethereum Tests $500 as ETH2.0 Deposits Hit 20% of 524,288 ETH Needed

John P. Njui   •   DEFI • ETHEREUM (ETH) NEWS   •   NOVEMBER 20, 2020

Quick take:

  • Ethereum finally retested $500 before falling back down to $490 levels
  • This feat was accomplished as the ETH2.0 deposits hit 20% of the required 524,288 ETH for Phase 0 to kick-off
  • Investors could increase the rate of their 32 ETH deposits as December 1st draws closer
  • Consequently, ETH could rally a second time above $500

The digital asset of Ethereum (ETH) has finally broken the $500 price ceiling to set a 2020 high of $501.84 – Binance rate. Ethereum last experienced these price levels in June of 2018 and during the brutal bear market that followed the 2017/2018 bull market.

How High Can Ethereum Go?

A quick glance at the daily ETH/USDT chart reveals that Ethereum is more or less in overbought territory as shall be explained using the chart below courtesy of Tradingview.


(Click image for larger view)

  • To begin with, trade volume is in the green further confirming the bullishness
  • Ethereum’s price is above the 50, 100 and 200-day moving averages, also confirming bullishness
  • However, the daily MACD is exhibiting signs of an overbought situation
  • The daily MFI and RSI are also high at 84 and 75 respectively
  • $480 to $490 has now flipped into a support zone and could mark an area of consolidation moving forward

Ethereum rallying above $500 could be as a result of investors speculating that the price of ETH could go higher as Phase 0 of ETH2.0 is launched on December 1st.

A quick glance at data from CryptoQuant.com reveals that a total of 106,976 ETH of the required 524,288 ETH has already been sent to the deposit contract for ETH2.0. This amount is 20.4% of the required Ethereum for Phase 0 of ETH2.0 to be launched by December 1st.

The 524,288 ETH requirement needs to be achieved by Monday, 23rd November, for Phase 0 to kick off on the scheduled date. This leaves a window of 4 days (including today) for Ethereum whales to send the required 32 ETH per validator to the deposit contract.

What could happen between now and Sunday, is a rush to deposit ETH to the staking contract which will result in crypto traders longing Ethereum based on the hype surrounding the deposits alone. However, there is also the possibility of the required 524,288 ETH not being achieved by Sunday and thus pushing the Phase 0 launch a few days or weeks forward.

Healthful Choice Wellness Store
Advertisement

Original article posted on the EthereumWorldNews.com site, by John P. Njui.

Article re-posted on Markethive by Jeffrey Sloe

Crypto Analyst Expects Ethereum and DeFi to Go on a Stupid Run

Crypto Analyst Expects Ethereum and DeFi to Go on a “Stupid Run”

By Cole Petersen – November 14, 2020 in ETH Reading Time: 2min read

The decentralized finance sector has posted massive gains throughout the past week, with all the “blue-chip” tokens seeing explosive momentum as bulls flood back into the embattled fragment of the crypto market at full speed.

This rebound first began when DeFi darling Yearn.finance’s YFI token hit lows of $7,500, at which point it incurred some massive momentum that sent it skyrocketing towards highs of $18,000.

It has since stabilized and is trying to post a high time frame close above this crucial level. If firmly broken and held above over an extended period of time, it could provide a base for it to grow upon that allows it to set fresh all-time highs.

In tandem with the price spikes seen by many crypto tokens within the ecosystem, liquidity providers’ yields on decentralized trading platforms have also rocketed.

This has justified the price movements seen by DeFi tokens and could create a tailwind to lift them higher.

One trader is now noting that he expects DeFi crypto assets to go on a “stupid run” in the near-term as the rest of the market shows continued strength.

He believes that the stability currently seen by Bitcoin, and a massive Ethereum rally, will incubate this next movement.

Crypto Market Stability Aids DeFi Rebound

The rebound seen throughout the larger DeFi tokens as of late can be seen while looking towards the DeFi perpetual index on FTX, which tracks the value of a handful of the top projects within the sector.

This contract bottomed at lows of $1,400 a couple of weeks ago and is currently trading at $2,160.

At its peak in late-August, the DeFi index reached highs of $3,500. Although it has a way to go before it reclaims these high, the recent lows are looking like a long-term bottom.

Analyst: DeFi Tokens Could Soon Rocket Higher

One analyst explained that he believes DeFi tokens are on the cusp of rocketing higher in the near-term, which will be incubated by Ethereum seeing a “stupid run.”

“Right now there is broad market strength in Defi blue chips, ETH, and Bitcoin. ETH looks like it wants to go on a stupid run. Send this and SNX YFI RUNE AAVE UNI all go bonkers to say the least,” he said.


Image Courtesy of Cantering Clark. (Click image for larger view)

Where Ethereum trends next will undoubtedly influence the broader DeFi market. Any continued strength could send smaller tokens rocketing higher.

Featured image from Unsplash. Pricing data from TradingView.

Definitive Guide to Swing Trading Stocks
Advertisement

The original article was written by Cole Petersen and posted on NewsBTC.com.

Article reposted on Markethive by Jeffrey Sloe

Ethereum Fdn Launches Community Grant Program to Support ETH20 Dev

Ethereum Fdn. Launches Community Grant Program to Support ETH2.0 Dev.

John P. Njui   •   ETHEREUM (ETH) NEWS • DEFI   •   NOVEMBER 14, 2020

Quick take:

  • The Ethereum Foundation is calling on developers to help build the ETH2.0 Ecosystem
  • This will be in the form of community grants
  • ETH2.0 mainnet deposit address is live with Phase 0 staking currently at 13.61%

Mid-last week, the Ethereum Foundation announced that it was launching a Community grants program geared towards building the ETH2.0 staking and validator ecosystem. The Ethereum Foundation went on to explain that there was more work to be done and the Ethereum developer community was an essential cog of the process.

The Ethereum Foundation is funding the creation of tools, documentation, and resources to make for a delightful staking and validator experience.

While the spirited staker ecosystem has already made great progress with respect to public good community resources, we are still in the early days and there’s more work to do!

All Are Welcome to Participate in Submitting Proposals

The announcement went on to clarify that the submission of proposals was open to anyone, or team, with a brilliant idea related to any aspect of ETH2.0. Additionally, ideas and projects at any stage of development were also welcome. This includes those in the idea phase, proof of concept stage, those that are a work in progress and even projects that are almost complete.

Phase 0 of ETH2.0 at 13.61%

At the time of writing, Phase 0 of ETH2.0 is at 13.61%. This is according to on-chain data courtesy of the team at CryptoQuant who have a dedicated dashboard focused on tracking the progress of the Ethereum upgrade. Below is one of the charts that shows the progress of Phase 0 derived from the amount of ETH sent to the deposit contract.


Source: CryptoQuant.com (Click image for larger view)

Phase 0 of ETH2.0 requires deposits of 32 ETH by 16,384 validators. This means that a total of 524,288 ETH, or roughly 0.46% of Ethereum’s total circulating supply, needs to be sent to the deposit contract to trigger Phase 0 on December 1st.

ecosystem for entrepreneurs
Markethive Advertisement

Original article posted on the EthereumWorldNews.com site, by John P. Njui.

Article re-posted on Markethive by Jeffrey Sloe

Ethereum Holders Sent 8170 ETH to Crypto Exchanges Before Dip to 370

Ethereum Holders Sent 8,170 ETH to Crypto Exchanges Before Dip to $370

John P. Njui   •   ETHEREUM (ETH) NEWS   •   NOVEMBER 3, 2020

Summary:

  • Crypto exchanges experienced an inflow of 8,170 ETH before yesterday’s dip to $370
  • This translates to around $3.1 Million using an Ethereum rate of $380
  • Of this amount 4,000 ETH was deposited to Binance before the brief meltdown
  • Selling of Ethereum could indicate buying exhaustion and a correction in the pipeline for ETH

This week kicked off on a tumultuous note in the crypto markets due to the two events of a US presidential elections today, and the rise of COVID19 cases in Europe that is causing further lockdowns. Early Monday saw the price of Ethereum drop from $404 to $370 in less than 6 hours.

Ethereum Holders Sent 8,170 ETH to Crypto Exchanges Before Dip

According to the team at CryptoQuant, approximately 8,170 ETH was sent to crypto exchanges before the dip. This translates to roughly $3.1 Million using Ethereum’s current price of $380. The team at CryptoQuant further shared their observation of the inflow of Ethereum into exchanges via the following tweet.

Also worth mentioning is that 4,000 ETH of this amount was sent to Binance 20 minutes before Ethereum took a brief nosedive in the crypto markets. This event was captured by the team at CoinMetrics as can be seen in the following tweet.

ETH Inflows Could Hint of a Local Top for Ethereum

The selling of Ethereum begun around the $400 price zone. This could signify that this price area was the last region that some ETH investors could sell their bags at a profit. Additionally, it could be the first sign of exhaustion for Ethereum at least for the month of November.


(Click image for larger view)

Further checking the daily ETH/USDT chart above, Ethereum could be in the midst of printing a bear flag that could result in the retest of several support zones above $300. They include those found at $365, $336, $320 and $309.

Also from the chart, the following can be observed.

  • The 50-day moving average is providing a level of support at the $370 price area
  • The 200-day MA is providing adequate support at the $300 price area
  • Failure of the aforementioned support zones could lead to Ethereum dropping to as low as $250
  • Trade volume is in the red with the daily MACD confirming bearishness for Ethereum
  • The daily MFI and RSI are also hinting at a correction at values of 58 and 46 respectively

Conclusion

Summing it up, Ethereum holders transferred 8,170 ETH to crypto exchanges before yesterday’s drop from $400 to $370. The transfer and subsequent selling could hint of bullish exhaustion for Ethereum and could open the doors for a correction for the better part of November.

As with all analyses of Ethereum, traders and investors are advised to use adequate stop losses when trading ETH on the various derivatives platforms.


ecosystem for entrepreneurs
Markethive Advertisement


Original article posted on the EthereumWorldNews.com site, by John P. Njui.

Article re-posted on Markethive by Jeffrey Sloe

Ethereum Reaches Bedrock Support Against BTC as Sellers Run Out of Fuel

Ethereum Reaches Bedrock Support Against BTC as Sellers Run Out of Fuel

By Cole Petersen – October 31, 2020 in ETH Reading Time: 2min read

Ethereum is in the process of trying to reclaim its key $380 support level following a brief dip below it earlier today.

The cryptocurrency has been struggling to gain any momentum despite the intense strength seen by Bitcoin as of late, which is currently grinding up towards its key resistance at $13,800 as buyers maintain full control over its price action.

Although BTC and ETH have been highly correlated in the past, they are now trading fully independent from one another.

This correlation only returns when BTC is showing signs of weakness, which places immense pressure on Ethereum.

The weakness seen by ETH as of late is particularly transparent while looking towards the cryptocurrency’s Bitcoin trading pair.

One analyst is noting that ETH/BTC has now reached a bedrock support level that he has been watching for quite some time. A strong defense of this level could confirm it as a long-term bottom and help catalyze a strong rebound in the days ahead.

Conversely, a break below this level would be dire.

Ethereum Struggles to Match Bitcoin’s Momentum as Bulls Try to Reclaim $380 

Earlier this week, Bitcoin faced a dire rejection at $480 that caused its price to see some immense short-term weakness that has since been erased.

Before this rejection, Ethereum was stable within the lower-$400 region. The subsequent BTC decline to lows of $12,800 caused ETH to reel all the way down to lows of $370.

It is now in the process of trying to reclaim its $380 support level but remains well below its multi-week highs of $420, while Bitcoin is just a stone’s throw away from setting fresh 2020 highs.

It is unclear when or if there will be a rotation of capital out of the benchmark cryptocurrency and back into altcoins.

Trader: ETH Reaches Critical Support Level

One trader explained in a recent tweet that Ethereum has now reached what he describes as a crucial support level on ETHBTC that he has been watching for quite some time.

He said that he is now lightening up on his bearishness and will reassess once the monthly candle closes tomorrow.

“I’ve been short biased (&short) ETH for quite a while now anticipating weakness into the monthly close. That has largely played out. Now that we’re hitting supports on the ETHBTC chart I’m going to lighten up and reassess once the monthly chart has actually closed.”


Image Courtesy of DonAlt. Source: ETHUSD on TradingView. (Click image for larger view)

Unless Bitcoin dives lower in the near-term, there’s a possibility that Ethereum will start bottoming out and recoup some of its recent losses.

Featured image from Unsplash.
Charts from TradingView.

Definitive Guide to Swing Trading Stocks
Advertisement

The original article written by Cole Petersen and posted on NewsBTC.com.

Article reposted on Markethive by Jeffrey Sloe

Ethereum Held on Exchanges Hits 268M ETH 237 of Circulating Supply

Ethereum Held on Exchanges Hits 26.8M ETH, 23.7% of Circulating Supply

John P. Njui   •   ETHEREUM (ETH) NEWS   •   OCTOBER 29, 2020

Summary:

  • 26.81 million Ethereum is held on centralized exchanges
  • This is 23.7% of Ethereum’s circulating supply
  • Majority of the ETH is held at Coinbase, Bitfinex and Huobi
  • Ethereum is once again above $390 and looking ready to attempt $400 once again

The amount of Ethereum held on centralized exchanges currently stands at 26.81 million ETH. This is according to data from CryptoRank Platform. This amount is also 23.7% of Ethereum’s circulating supply. Of this amount, the majority of the Ethereum is held on Coinbase (8.52 million ETH), Bitfinex (5.27 million ETH) and Huobi (3.26 million ETH). Binance and Kraken wallets currently hold 2.95 million ETH and 2.43 million ETH respectively.

Ethereum is Once Again Trading Above $390 and Could Retest $400

In terms of the current value of Ethereum, ETH is once again attempting to claim the $390 resistance area as support. At the time of writing, Ethereum is trading exactly at $390 amidst the Bitcoin revival that has seen the King of Crypto bounce back from $12,900 levels to $13,487.

The bullishness of Bitcoin is one reason Ethereum could just turn the $390 price area into support and possibly attempt $400 in the days ahead. This is despite the fact that the daily ETH/USDT chart clearly hints of a correction for Ethereum. If Bitcoin can retest its recent high of $13,869, Ethereum might once again trade above $400.


(Click image for larger view)

Taking a closer look at the daily ETH/USDT chart above, the following can be observed.

  • Trade volume is in the red but hinting at a reduction in selling
  • The daily MACD is about to cross in a bearish manner above the baseline
  • The daily MFI and RSI point towards a correction for Ethereum at a value of 60 and 54 respectively
  • However, Ethereum’s price is above the 50, 100 and 200-day moving averages further foreshadowing a push up for Ethereum based on Bitcoin’s market momentum
  • The 50-day and 100-day MAs provide considerable support at the $380 price area

As with all analyses of Ethereum, traders and investors are advised to have an eye out for any Bitcoin moves that might ruin the party. Additionally, stop losses are advised given the fact that Bitcoin tends to ‘suck the capital’ from Ethereum and alts whenever it pumps hard.

definitive guide to swing trading stocks
Markethive Advertisement

Original article posted on the EthereumWorldNews.com site, by John P. Njui.

Article re-posted on Markethive by Jeffrey Sloe

Ethereum Stares at 420 Thanks to PayPal as ETH 20 Gathers Steam

Ethereum Stares at $420 Thanks to PayPal as ETH 2.0 Gathers Steam

John P. Njui   •   ETHEREUM (ETH) NEWS – DEFI   •   OCTOBER 22, 2020

Summary:

  • Ethereum’s value has received a major boost from the PayPal news
  • Ethereum is one of the major digital assets that PayPal’s crypto service will support
  • ETH has since broken the $390 and $400 resistance levels with $420 up ahead
  • Progress on ETH2.0 has continued to gather steam with a deposit contract expected any time soon

The news of PayPal beginning to offer crypto services to its US users is still very much being felt in the crypto markets. Taking a quick look at Bitcoin, the announcement has resulted in the King of Crypto zooming past several resistance levels to print a 2020 peak value of $13,267 set earlier today. In the case of Ethereum, the PayPal news has had a similar effect with ETH breaking the $390 and $400 resistance levels in quick succession.

Ethereum is Staring at $420 Next

In terms of resistance levels, Ethereum is once again in familiar territory as ETH is facing resistance levels experienced in August during the DeFi boom of Q3. These resistance levels include those that can be found in the following price zones.

  • $416 to $420
  • $445 to $450
  • $488 to $490 (August peak)


(Click image for larger view)

At the time of writing, Ethereum is trading at $412 and according to the daily chart above, ETH could retest $420 in the hours or days to follow. The chart is the daily ETH/USDT which also provides the following information.

  • Trade volume is in the green with the daily MACD confirming bullishness
  • Price is above the 50, 100 and 200-day moving averages painting a bullish future for Ethereum
  • However, MFI and RSI are a bit high at 70 and 67 respectively hinting that Ethereum only has enough gas in its tanks for one more push to the mentioned $420 price level

ETH2.0 Continues to Gather Steam

The PayPal news has pretty much overshadowed the recent ETH2.0 development update by ConsenSys developer Ben Edington in which he explained that the deposit contract should be launched any time soon. He also explained that ETH2.0’s beacon chain genesis will happen within the next six to eight weeks.

Speaking of which – I am expecting news about the deposit contract any day now. Probably about 10 minutes after I publish this. Basically, as I understand it, we are good to go: deposit contract in the next few days; beacon chain genesis 6-8 weeks later. (This is not an official statement!)

Conclusion

Summing it up, the news of PayPal offering crypto services has provided the bullish momentum for Ethereum to break the $390 and $400 resistance levels in quick succession. As a result, Ethereum is facing a similar situation to the one observed during August’s DeFi boom that resulted in ETH printing a local top at around $488.

Additionally, ETH2.0 development continues to gather traction with the deposit address for staking expected any time soon and beacon chain genesis could be launched in the next six to eight weeks.

In terms of short term price action, Ethereum is staring at $420 and a break of this level could open the doors to $450 and even $488 once ETH2.0 development starts moving to the Ethereum mainnet.

definitive guide to swing trading stocks
Markethive Advertisement

Original article posted on the EthereumWorldNews.com site, by John P. Njui.

Article re-posted on Markethive by Jeffrey Sloe